Answer the questions the work depends on
The analysis that studies, capacity assessments and regulatory reporting are built on — running against live data rather than an extract.
I&I analysis that starts from a draft
Inflow and infiltration (I&I) analysis is normally complex and tedious, and it gets re-derived for every study. infinitii flowworks combines sewer and rainfall data in a purpose-built analyser and produces average dry weather flow and return-period I&I estimates using the envelope method. Groundwater infiltration is not one of the tool’s outputs, but it can be built as a calculated channel in FACE Pro.
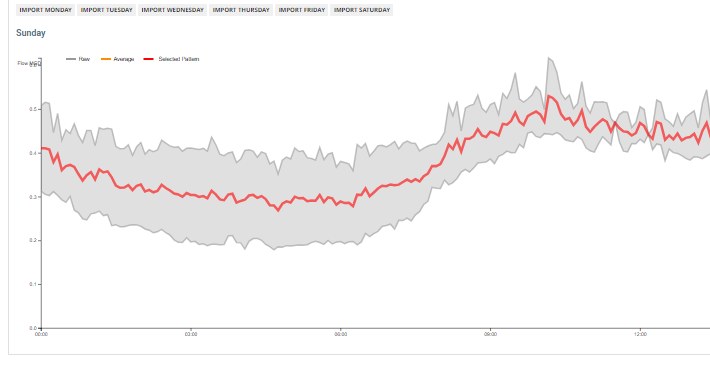
Auto I&I, part of Infinitii I&I, seeds a new project with dry weather patterns and storm event groups already identified. The engineer starts by disagreeing with a draft rather than building one.
Its central output is the I&I Envelope — a graph of rainfall derived infiltration and inflow (RDII) flow against 24-hour rainfall total, one point per rain event. Two linear fits are drawn through it: a best fit to average RDII flow and a second to maximum flow, with an r² saying how much of the variability the rainfall actually explains. The x-axis is graduated with your site’s intensity-duration-frequency (IDF) values at the 2, 5, 10, 25, 50 and 100-year return periods, so the severity of each event is readable directly off the chart. More rain events generally mean a better estimate.
When a site needs closer attention, convert the Auto I&I results into a manual I&I project and work with a chosen subset of storm events instead of all of them.
RDII visualisation shows the impact by catchment, which is what turns an I&I number into a decision about where to spend.
- Auto I&I — dry weather patterns and storm events identified automatically
- ADWF and return-period I&I estimates (envelope method)
- RDII impact visualised by catchment
- Pump station data converted into flow estimates
Storm analysis
IDF curve analysis
Place any current or historical storm against historical values and return periods, using the local record rather than a published curve that may not fit it.
Rainfall mass balance
Tie the rainfall total to what the collection system actually received — the check that usually explains a surprising I&I result.
Rainfall statistics and intensity
Hourly, daily and monthly totals with duration-based statistics from 5 minutes to 24 hours, plus intensity reporting.
Getting from the record to an answer
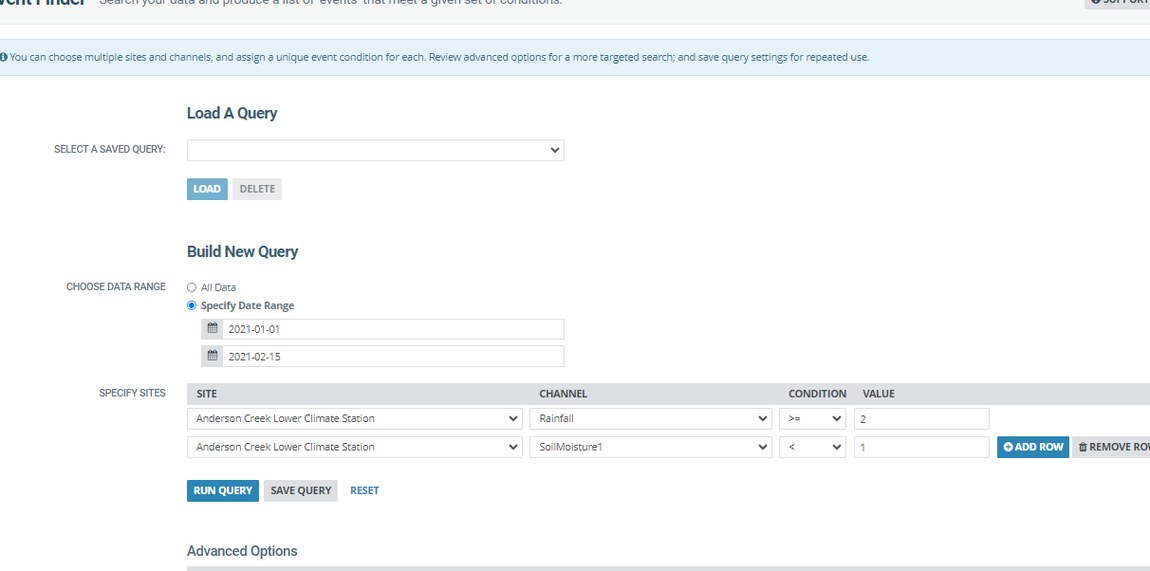
The event finder queries the data rather than making you scroll it — find every occasion a channel exceeded a value, for a duration, within a period, across a set of sites.
Channel reporting turns the result into daily, monthly and yearly summaries that run on a schedule, so a regular submission is produced from the maintained and auditable source instead of being assembled each time.
- Event finder — query by threshold, duration and site set
- Daily, monthly and yearly summary reports
- Scheduled reporting from the live source
- Distribution to clients and stakeholders who do not use the application
In detail
Analytics
I&I, RDII, IDF curves and rainfall analysis.
Reporting
Summaries, schedules and distribution.
Extensibility
When the built-in features do not go far enough
Re-run a study you did by hand
The most convincing demo is one that reproduces an analysis you already know the answer to.