Reporting
Daily, monthly and yearly summaries produced from the maintained and auditable source, on a schedule.
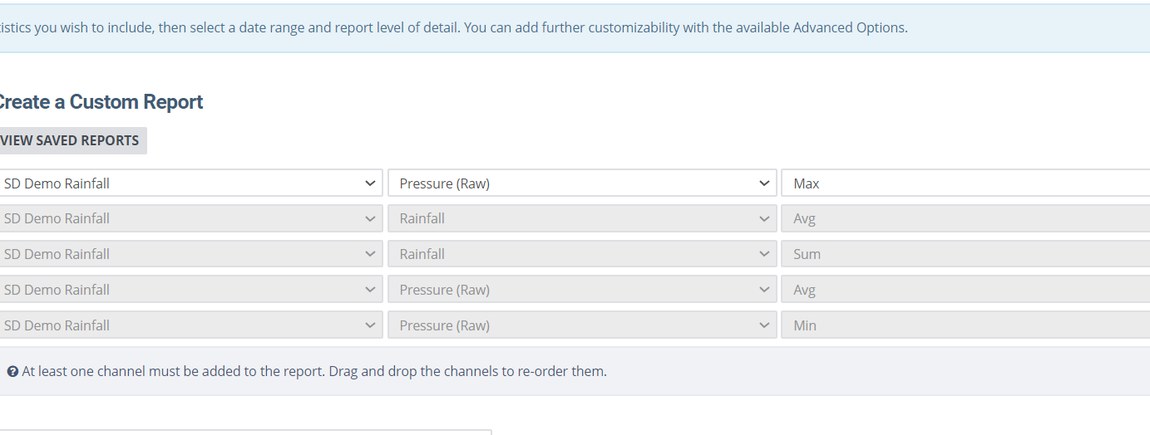
What it does
Reporting draws on the same data everyone has been monitoring, so the number in the submission and the number on the screen have a traceable relationship — including any corrections, which remain visible in the edit history rather than being silently applied.
Reports run on a schedule and can be distributed to clients and other stakeholders who are not application users. In practice this is often how infinitii flowworks reaches the rest of an organisation: somebody starts receiving a report, then asks for a dashboard.
A report is the right answer when you need a summary for a particular period in time — monthly reports, regulatory submissions. When somebody needs to know what is happening now, a dashboard is the better tool.
For the annual-report case, multi-graph review does the bulk work: take a group of saved graphs — each already tied to the sites and channels it was built with — set a date range and an interval, and it produces one output per period, delivered as a single merged PDF or a ZIP of individual files. A year of monthly graphs across a network is one action rather than an afternoon.
- Daily, monthly and yearly summary statistics
- Scheduled generation from the live source
- Distribution to people who do not use the application
- Corrections visible in the edit history behind the number
- Batch graph output by period, as merged PDF or one file per graph
Where this sits
Analysis
This capability is part of the analysis group.
All features
The other five groups.
Solutions
Or start from the problem instead.
See it on your own data
Feature lists are hard to judge. A demo runs on your sites and your history.