Photo channels, alongside the measurements
For sites where the number alone does not tell you what happened — images from embedded cameras, stored as a channel beside the readings they explain.
Why imagery belongs with the data
A level reading that jumps is either a real event or a blocked sensor, and the difference matters. Conventional surveillance does not help: it is a separate system, usually needs mains power and bandwidth neither available at the site, and its recordings are not aligned with the measurements you are trying to explain.
infinitii flowworks supports the specialised camera systems built for exactly these conditions — battery powered and wireless, optimising bandwidth and power — and stores what they capture as a photo channel. We do not sell cameras; we support them, the same way we support any other instrument. Scroll the graph and the imagery scrolls with it.
What people use it for
All of these come from sites where a traditional surveillance system was not an option.
Weather stations
Confirm snow depth, icing or obstruction at the moment a reading looks unusual.
River morphology
Bed movement, trash rack buildup and flood stage recorded through the event rather than inspected afterwards.
Vandalism and illegal dumping
Document what happened and when, at sites where the first evidence is usually a damaged instrument.
Facility troubleshooting
See the equipment state that produced the anomalous reading, without a site visit.
Temporary event surveillance
Stand up coverage for a construction period or a seasonal risk, then take it down.
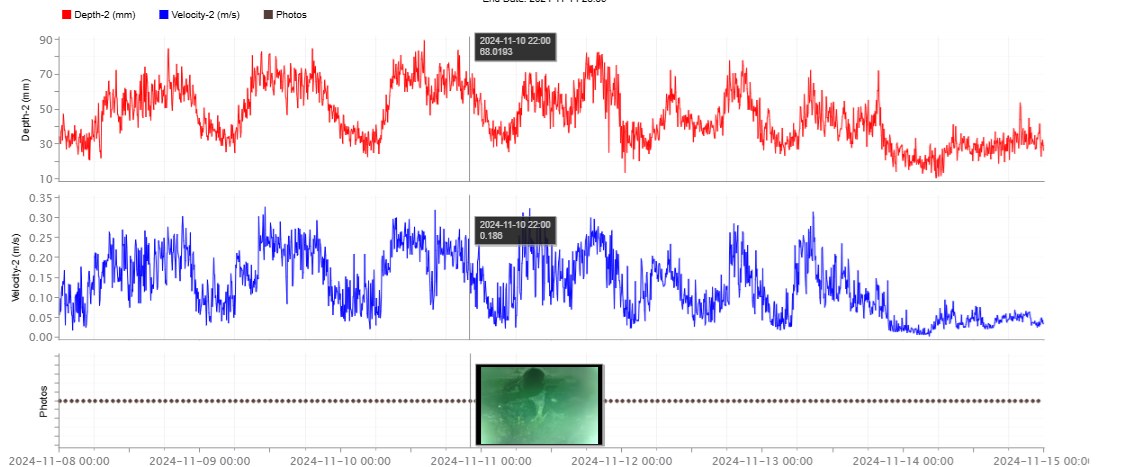
A photo channel behaves like any other channel
A photo channel collects images from an embedded camera at the site, one per reading interval, and stores them the way any other channel is stored. So the imagery appears in the graph view alongside level, flow or rainfall: you are not correlating two systems by timestamp, because they are already the same record.
Metadata is information held against the site — custom fields such as an installation date, or an inspection report attached as a PDF. What appears alongside the time series is different: a notes channel, where analysts, operators and installers record conditions at a point in time so anyone else looking at the same data sees their comments.
- Imagery aligned to the measurement timeline in the graph view
- Battery powered, wireless camera systems for sites without services
- Bandwidth and power optimised for remote deployment
- Field observations and documents stored against the site
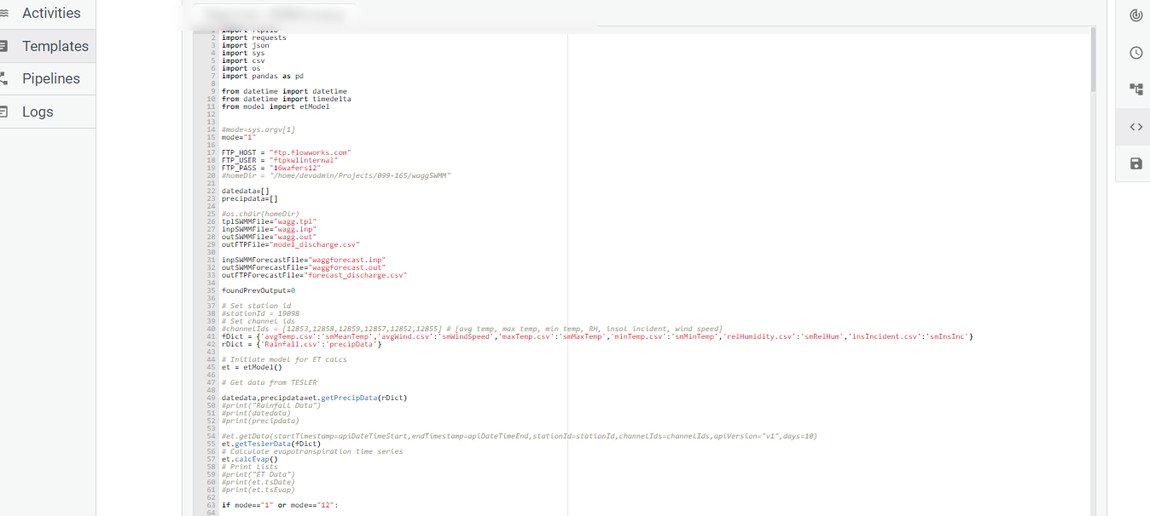
Images a script can compare
Once images are a channel, they are available to FACE Pro like any other data. A script can compare images stored in a infinitii flowworks channel and produce a result you can graph and alarm on — which turns a camera from something you check into something that tells you when to look.
What FACE Pro can be used to build. There is no ready-made template — customers either write the scripts themselves or have infinitii ai build one for them.
- Compare successive images from a photo channel in a FACE Pro script
- Visual Condition Change Index — a change score you can trend and alarm on
- Output behaves like any calculated channel: graph it, alarm on it, report on it
- Write your own comparison in Python where the change you care about is specific
Where this sits
Visualization
This capability is part of the visualization group.
Extensibility
Comparing images in a FACE Pro script.
Solutions
Or start from the problem instead.
See imagery beside your own data
Most people understand this one fastest by looking at it — a graph with the pictures attached.