Rainfall monitoring and storm analysis
Turn a rain gauge network into return periods, intensity-duration-frequency (IDF) curves and storm statistics — and put a recorded event in the context of the historical record.
Where most rainfall work starts
Your existing rain gauges keep working, whoever made them. Tipping-bucket, weighing and optical gauges all arrive as raw channels, on the same timeline as the flow they explain — so the network you already run is the starting point, not something to replace.
Rain gauge data arrives as files. Getting from those files to a defensible statement about a storm — how big was it, how unusual, how does it compare with the modelled result from a simulation — means assembling duration statistics manually, then finding a published IDF curve that may not reflect the local record.
Meanwhile the gauges themselves are sparse. Between them, rainfall is assumed.
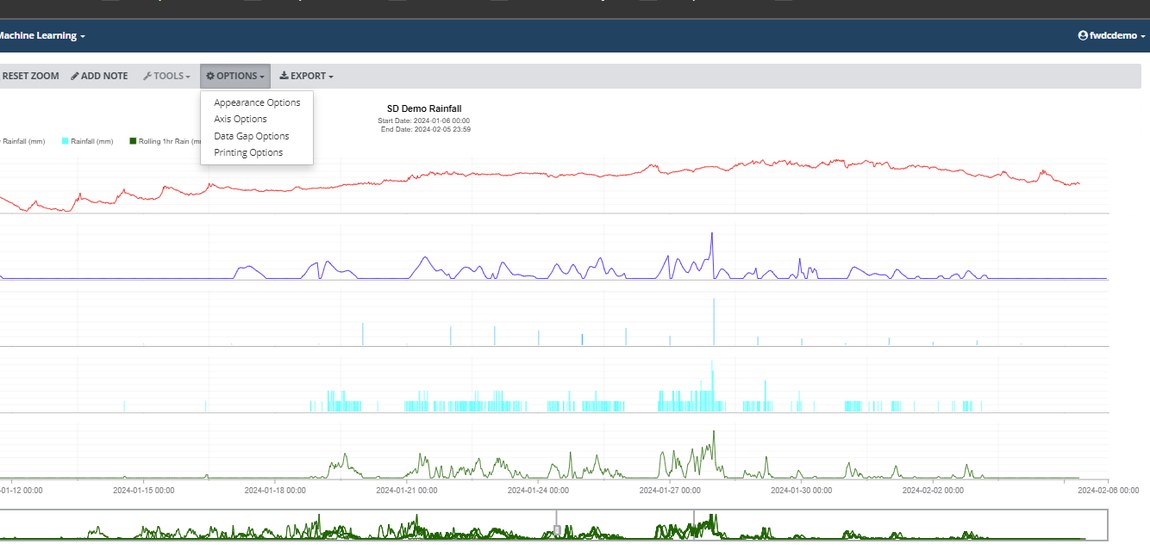
Is this storm unusual? Answered while it is still raining
IDF analysis overlays the storm you are recording on the historical intensity–duration–frequency curves for that site. Those curves come from the National Oceanic and Atmospheric Administration or Environment Canada and are normally associated with a rainfall site automatically — or you can supply your own where you hold better local records.
Reading it is direct. Where your storm line crosses a historical curve, the event has exceeded that return period at that duration. A storm crossing the ten-year line at the 30-minute point was a ten-year event for that duration, whatever it amounted to over 24 hours.
And because the analysis updates as data arrives, you can watch a storm develop against the historical record in real time rather than waiting for the analysis.
- Historical IDF curves from NOAA or Environment Canada, associated with the site
- Supply your own curves where you hold more detailed local records
- Return period identified per duration, from 5 minutes to 24 hours
- Updates as new data arrives — usable during the storm, not only after it
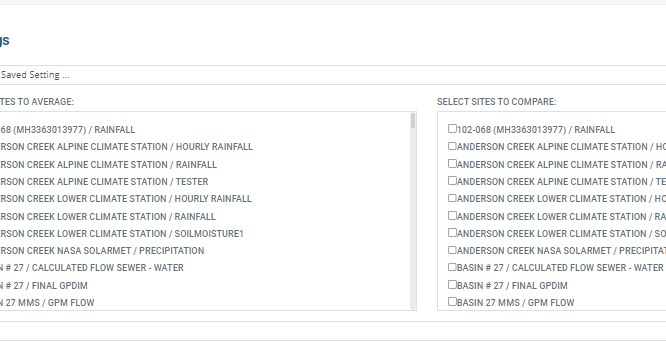
Checking the gauges against each other
The mass balance tool compares rainfall sites against the cumulative average of related sites. It is how you cross-reference and validate a rainfall record: a gauge sitting consistently below the group is telling you something about the gauge rather than about the weather.
A blocked funnel or a sticking tipping bucket quietly understates a storm, and rainfall is the input to everything downstream of it. This is the cheapest check available on a gauge network.
Queries save as templates with relative date ranges, so the same validation runs next season without needing to be re-built.
- Compare a site against the cumulative average of its related sites
- Identify gauges drifting away from the regional picture
- Save settings and re-run as a template, with relative date ranges
Summaries, mapping and alarms
Summaries and statistics
A monthly rainfall summary with hourly, daily and monthly totals, alongside duration-based statistics from 5 minutes to 24 hours — the numbers a report needs, produced rather than assembled.
Isohyetal mapping
How the storm fell across the catchment rather than at the gauge — usually what explains why one catchment responded and its neighbour did not.
Alarms on rain
Notify on intensity or accumulation so the wet weather response starts on the rainfall rather than on the overflow it causes.
A live storm board
Rainfall is the case where a report is least use — nobody wants last month’s storm summary while it is raining. A custom dashboard puts intensity, accumulation, which gauges are wettest and where the event sits against the IDF curves on one screen, updating as it happens.
Public sources, radar and forecast
A gauge network tells you what fell at the gauge. Three kinds of outside data fill in the rest, and all of them arrive as raw channels.
Public observation data from NOAA, Environment Canada and similar services comes in automatically over web API — the same organisations whose IDF curves sit behind the analysis above.
Gauge-adjusted radar rainfall from third-party providers gives the spatial picture between gauges, from radar corrected against ground measurements.
Third-party weather modelling data brings the forecast in, which is what makes predictive work possible.
- Public observation data from NOAA, Environment Canada and similar services
- Third-party gauge-adjusted radar rainfall, as a standard channel
- Third-party weather modelling and forecast data
- All usable anywhere a gauge channel is — graphs, alarms, inflow and infiltration (I&I) analysis, calculated channels

Rain that has not fallen yet
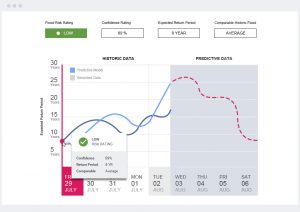
Once forecast rainfall is a channel in the same system as your measured rainfall and your flow, it drives a calculation like any other input. That is the basis of predictive work — not what happened, but what is about to, with enough lead time to act on it.
Predictive channels are built in FACE Pro in Python or R, deployed once and run continuously, so a forecast-driven prediction updates itself as both the forecast and the live data change. Paired with hydraulic model integration, the forecast can drive the model rather than a prepared input file.
- Forecast rainfall from third-party weather modelling services, as a channel
- Predictive channels in FACE Pro, running continuously against live and forecast data
- Forecast-driven hydraulic model runs through model integration
- Alarm and report on a predicted condition, not only a measured one
Overflow risk is the worked example. Forecast rainfall drives a prediction of how the collection system will respond, and each event is classified against IDF data so staff can tell a routine rain from a genuine design storm. It is a custom deployment rather than part of a standard subscription — which is how a good deal of infinitii flowworks starts life. Ask if it applies to your system.
Stormwater methods, deployed as channels
Where the built-in rainfall analysis stops, FACE Pro carries on. Standard stormwater methods can be written once in Python and run continuously against incoming rainfall, producing channels you graph, alarm and report on like any other.
Some of the things FACE Pro can be used to build. infinitii flowworks can help create these channels during account setup if required.
- Rational Method runoff estimation
- Green–Ampt infiltration
- IDF intensity as a live calculated channel
- Rainfall-driven rainfall derived infiltration and inflow (RDII) — RTK unit hydrograph estimation, wet/dry classification, unit I&I rate
Scripts take site-specific constants as parameters, so one template covers a whole gauge network with per-site values.
Who this helps, and how
Modelling and design
Return periods and IDF curves from the local record, in a form that survives review, and rainfall that lines up with the flow data it is being correlated against.
Operations during a storm
Alarms on rainfall intensity and accumulation, so the wet weather response starts on the rain rather than on the overflow.
Everyone downstream of the rainfall record
I&I estimates, model calibration and design work all inherit whatever the gauges recorded. Mass balance validation matters most to the people who never touch a rain gauge and depend on it anyway.
Reporting after one
A summary of what fell, where, and how unusual it was — produced from the record rather than reconstructed.
Related
Wastewater
I&I, overflow activity and capacity.
Climate
The rest of the met station — temperature, wind, solar radiation, snow.
Streamflow
Stage, discharge and flood response in the receiving water.
Put last year's biggest storm in context
Bring an event you had to characterise by hand and we will run it against your own historical record.