Climate station management
Temperature, relative humidity, wind speed and direction, solar radiation, rainfall and snow — managed alongside the flow data they help explain.
Where most climate records sit
A climate station produces a lot of parameters, and most of them are only looked at when something else needs explaining. The record lives in the logger network or the SCADA system, separate from the flow and rainfall data it is most useful next to, so correlating the two is a manual export every time.
Weather data, in with everything else
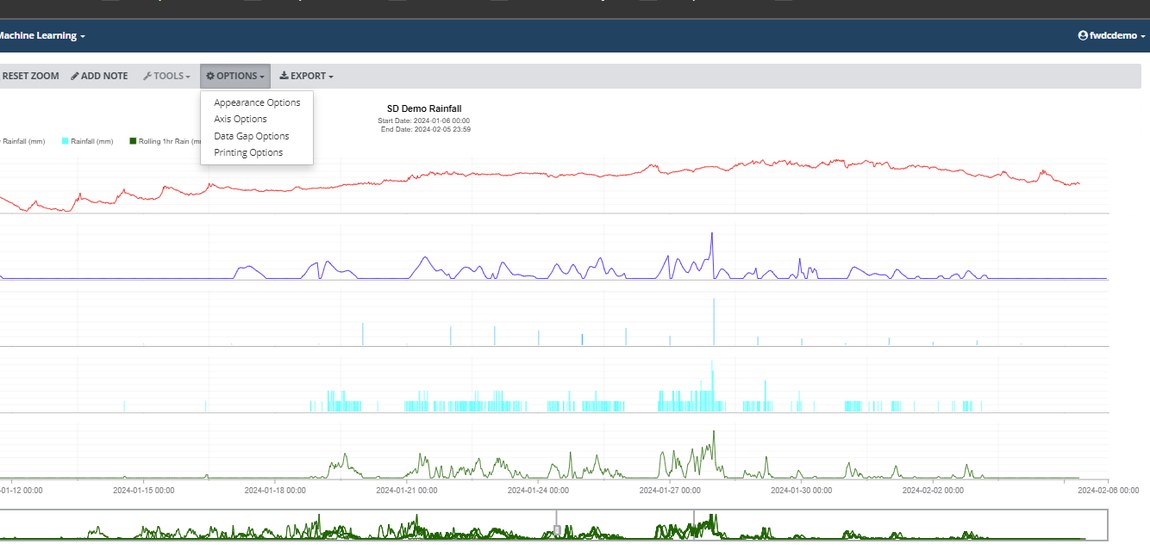
Link live and historic climate station data from your logger network or SCADA system and it becomes raw channels. Which means you can graph a climate parameter against any other site in your system on one chart, with a saved template, rather than exporting both and joining them by timestamp.
Curve fitting then quantifies the trend you suspected instead of leaving it as an impression. Five general fits — linear, polynomial, exponential, logarithmic and power — apply to any pair of parameters, which is most of what climate trend work needs.
- Graphing that combines climate stations with any other site type
- Monthly summaries with duration statistics from 5 minutes to 24 hours
- Curve fitting across five general fits to quantify a trend
- intensity-duration-frequency (IDF) analysis on the rainfall the station records
- Custom dashboards covering the whole climate network — and, more usefully, climate parameters placed beside the flow and rainfall they explain

Climate data is what explains the flow
The answers to many questions about how a system behaved are found in the climate data recorded alongside it.
Temperature and solar radiation drive snow melt; snow melt, soil moisture and evapotranspiration govern how much becomes runoff; runoff drives the discharge you are trying to predict. Each of those intermediate quantities can be derived as a calculated channel in FACE Pro from the parameters climate stations record — your own, or third-party stations brought in to supplement them.
Potential evapotranspiration (PET) is the clearest example. A FACE Pro script computes it by the FAO-56 Penman–Monteith method from six channels — mean, maximum and minimum temperature, relative humidity, incident solar radiation and wind speed — with elevation, latitude and albedo as site constants. Those channels may come from your own station or from a government or third-party source.
That is how climate data feeds continuous hydrological simulation — see model integration on streamflow, where snow melt and soil moisture are inputs to a RAVEN model predicting creek discharge.
- Snow melt derived from temperature and solar radiation
- Soil moisture as a contributing-source channel
- Potential evapotranspiration by FAO-56 Penman–Monteith, from temperature, humidity, solar radiation and wind
- Derived channels usable as model inputs, not just as charts
- Feeds continuous simulation and forecast-driven prediction
Your station, and the agency network around it
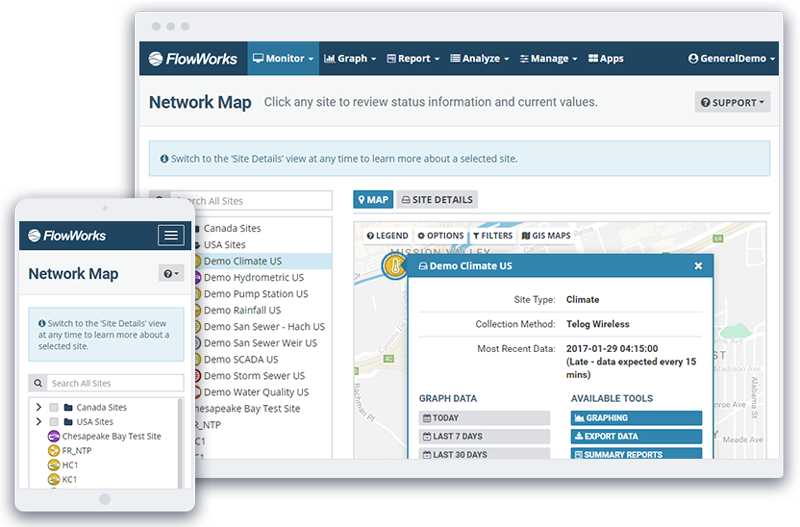
Your own climate station tells you conditions at that station. Environment Canada, NOAA, NASA and similar services can be configured as sites and channels alongside it, so the regional picture and your local measurement sit in one place.
Useful for redundancy and to complement your own sources: as a cross-check when a reading looks questionable, and as cover where you have no station of your own.
- Environment Canada, NOAA, NASA and similar services as configured channels
- Regional context for a local reading that looks wrong
- Coverage where you have no station of your own
- Third-party weather model data as a forecast input
Around the station
Site imagery
A field camera at the station captures snow depth, icing or obstruction as an photo channel stored with the readings, so an odd value can be checked against what the site actually looked like.
Verification records
Date- and time-stamped photos, verification measurements and field observations, kept with the data they qualify rather than in a separate log.
Hardware neutrality
Work with the gauging equipment you already own. infinitii flowworks does not sell sensors or telemetry — it supports them, whoever made them, which is rather the point.
Related
Rainfall
IDF curves, return periods and radar rainfall.
Streamflow
Stage and discharge in the receiving water.
Collection & integration
What infinitii flowworks connects to, and how new sources get added.
See your met record next to your flow data
Most people find the value the first time they put two parameters on one chart that have never been on one chart before.