Graphing
Hydrographs and time series across sites, scatter plots with curve fitting, and imagery on the same timeline.
What it does
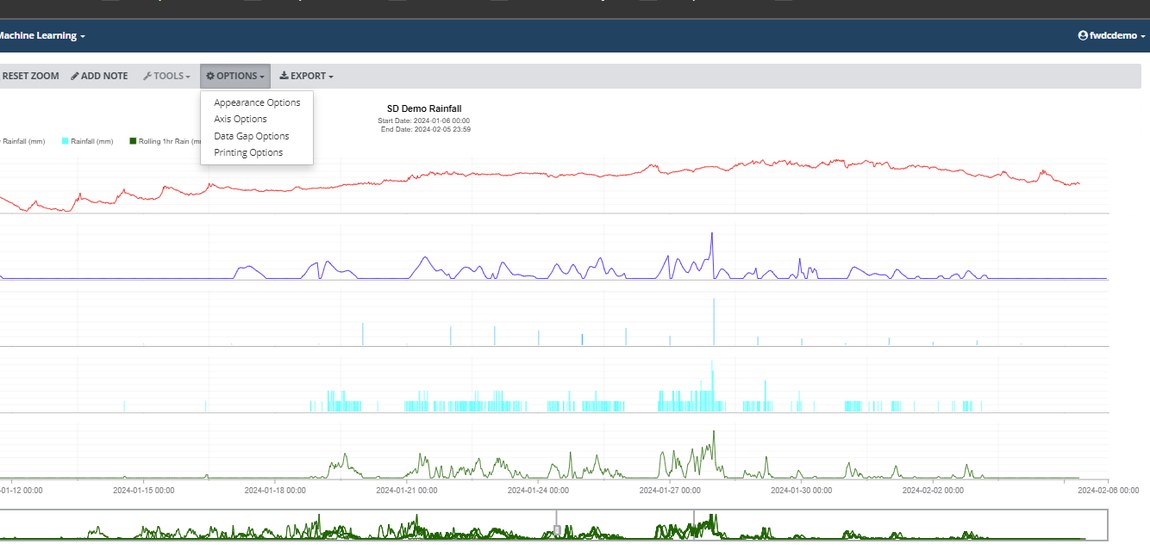
Graph any channel against any other, across any set of sites, and save the arrangement as a template so the next month's version is one click rather than a rebuild.
Scatter plots with curve fitting quantify a relationship between two parameters instead of leaving it as an impression. Seven fits are available — linear, polynomial, exponential, logarithmic, power, Manning and Froude. Manning and Froude are specific to collection systems; the other five apply to any pair of parameters in your data, whatever you are monitoring. Fits can be saved and reused on other graphs.
The pipe diagram overlay places a level/velocity/flow scatter in the context of the pipe it came from, which is usually what distinguishes a real hydraulic condition from an instrument problem.
Photos are not necessarily captured at the same moment as a sensor reading — the collection frequency may differ — but they sit on the same timeline, so the nearest image to a reading is right there.
Multi-graph viewing lets you view, save or print a number of pre-selected saved graphs that are needed together as a report. It is set up once and reused.
- Multi-site hydrographs and time series with saved templates
- Seven curve fits: linear, polynomial, exponential, logarithmic, power, Manning and Froude
- Pipe diagram overlay for level, velocity and flow
- Photo channels aligned to the measurement timeline
- Multi-graph review: many saved graphs, one date range, batch PDF output
Where this sits
Visualization
This capability is part of the visualization group.
All features
The other five groups.
Solutions
Or start from the problem instead.
See it on your own data
Feature lists are hard to judge. A demo runs on your sites and your history.