Water system monitoring and analysis
Distribution pressure, pressure reducing valve (PRV) performance, reservoir levels and water quality — whether you run a few sensors or several thousand measurement points.
Where most water teams start
Chlorine residual at the end of the system is confirmed by a periodic sampling round rather than measured continuously by sensor. And the SCADA historian, the logger portal and the lab results sit in three separate places rather than a common repository.
None of that is a sensor problem. It is a consequence of data being organised by who supplied the hardware instead of by the question you are trying to answer.
How infinitii flowworks answers them
Each of the problems above has a specific answer, not a general one.
The pressure problem
Pressure at every monitored point is current, not recovered from a logger a week later. When it drops below a threshold the alarm names the site, the value and the time, and the history behind it is one click away — so whether the complaint is valid is a question you answer the same afternoon.
The PRV you only see at inspection
Watch upstream and downstream pressure continuously and the station’s behaviour stops being an assumption between visits. You can see whether it opens and closes at the pressures it is set to, and whether it is sticking, from the record rather than from a site visit that happens to catch it.
Chlorine residual at the end of the system
Residual is monitored as a channel and alarmed like any other, so a failure to reach the end of the system is something you are told about rather than something the next sampling round discovers. Lab results are stored alongside the online sensors, so the two can be compared directly instead of in a spreadsheet.
Data in three places
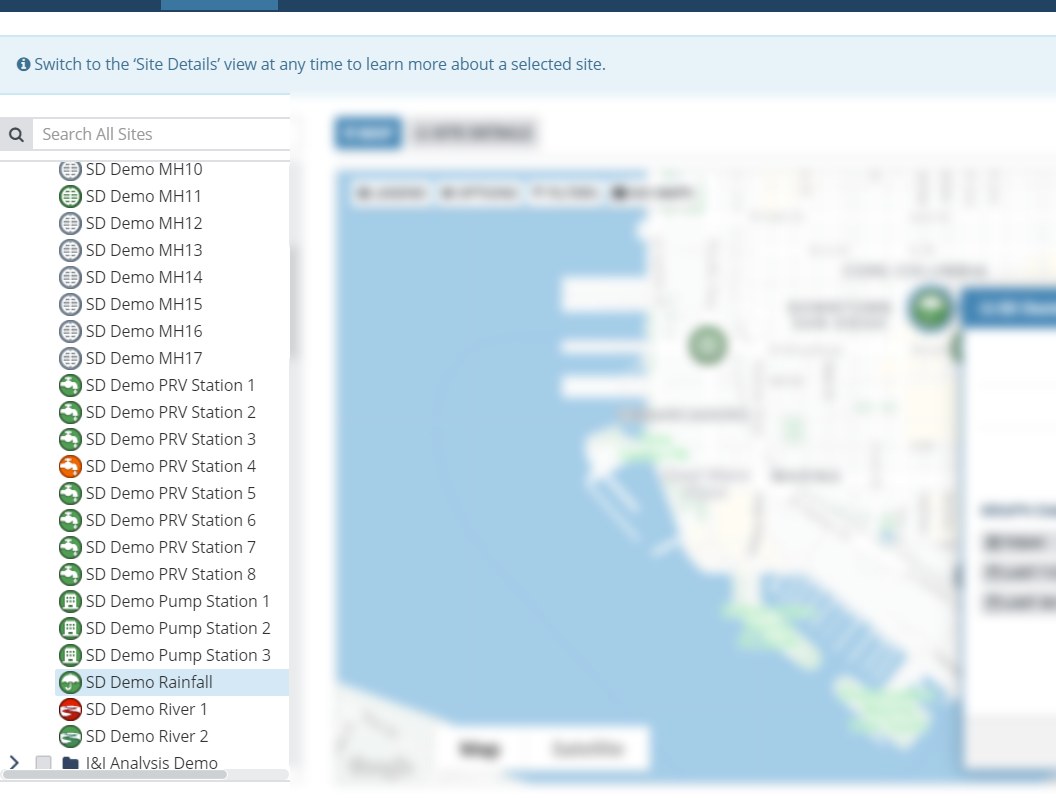
The SCADA historian, the logger fleet and the lab results become channels in one system. Every site appears on a map with its present value and alarm state; click one to reach its history, its graphs and its metadata. And a custom dashboard puts the whole network on one screen — pressures, reservoir levels and residuals arranged for a control room or a duty phone rather than for the database.
Your SCADA data, with everything else next to it
infinitii flowworks is not a replacement for your SCADA system and does not try to be one. It is where SCADA data becomes useful next to everything your SCADA system does not hold — the logger fleet, the rain gauges, the lab results, the public sources.
Once a SCADA point is a channel, it behaves like any other channel. That is what makes the combinations possible.
- Build a new channel from SCADA inputs and sensor inputs together — a calculation neither system could do alone
- Quantify a relationship between any two parameters with curve fitting — linear, polynomial, exponential, logarithmic or power
- Set alarms and notifications on SCADA values, delivered by web, email, SMS or voice
- Run FACE Pro pattern recognition against SCADA data, for anomaly detection and behaviour that a fixed threshold will not catch
- Graph SCADA points against rainfall, lab results or any other source on one chart
Beyond pressure and flow
Reservoir and intake imagery
A field camera records intake buildup, reservoir condition or vandalism, and the images are stored as a channel beside the measurements — so you can see what the site looked like at the moment a reading changed.
Metadata and verification records
Date- and time-stamped photos, verification measurements and field observations, stored online as data forms or attached documents. Water quality reports sit alongside the real-time data they relate to.
Public sources in, your data out
Public sources — NOAA, Environment Canada, weather modelling services — arrive over web API on the same footing as your own sensors and SCADA points, so forecast and observed conditions sit beside what your network is measuring. The infinitii flowworks API runs the other way too, publishing live channels to your own public or internal website.
Who this helps, and how
Running the distribution system
Know the state of the network without waiting for a problem to be reported. An alarm carries the reason, the threshold or calculation behind it, and the history, so whoever receives it can see why it fired.
Keeping the data defensible
Flag and correct suspect readings without destroying the original. Every edit keeps an audit trail, and corrected values are published as their own channel so everyone downstream is working from the same numbers.
Planning and capital work
Compare this year against the last ten at the same sites, and take the evidence into a prioritisation argument in a form other people can check.
Confirming a site is actually live
After an install, see immediately whether data is arriving and whether it looks sane — on a phone, at the site, before leaving it.
Questions this answers
Taken from what water operators actually ask of their data.
- Where are my sites, and what are the current conditions?
- What have flows and pressures at a group of sites looked like this week? This year? Over ten years?
- How many start/stops per day are my pumps doing, and is one performing better than the other?
- What were the minimum, average and maximum flows at a site last month?
- Can I see a year of water quality results for a site, against the online sensors?
- Are the low-pressure complaints from that neighbourhood valid?
- How is that PRV station performing — is it sticking? Does it open and close at the right pressures?
- Are we chlorinating enough to reach the end of the system?
Related
Facilities
Pump stations, treatment plants and PRV stations: run hours, duty balance and compliance.
Visual
Camera imagery for sites where a number alone does not explain what happened.
Wastewater
Collection systems, overflow monitoring and inflow and infiltration (I&I) analysis.
See it on your own network
A demo runs on your sites and your history. Bring a question you have not been able to answer easily and we will start there.