Pump stations, treatment plants and PRV stations
Know what a facility is doing, be told when it stops, and be able to show how it has performed over the year.
Where most facilities monitoring starts
The plant has a SCADA system and the outlying stations do not. Run hours are totalled at the end of the month if anyone asks. Duty balance between pumps is assumed rather than measured. A chlorination failure is discovered during the reporting cycle rather than when it happens. And the sites without telemetry are visited on a schedule that has more to do with the drive than the risk.
Every facility reporting, including the awkward ones
If a facility is already on SCADA or a data logger, linking it is straightforward. Outlying sites reporting over cellular or satellite telemetry connect the same way — which is usually what brings near real-time monitoring within reach at stations where it previously looked prohibitively expensive.
Once connected, run hours, duty balance and compliance stop being end-of-month reconstructions.
- Pump run hours and start/stop counts, per pump, per day
- Pump Station Calculator — volumetric flow through a pump derived from run time, without metering it
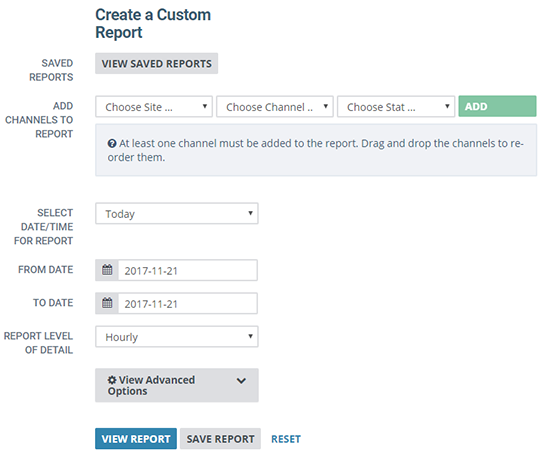
- Scatter plots with curve fitting — linear, polynomial, exponential, logarithmic and power — to quantify a relationship between any two parameters
- Alarm notification when a site reaches a critical value
- Daily, monthly and yearly summary reports
Flow through a pump, without metering the pump
Knowing the volume that has passed through a pump usually means installing sensors upstream and downstream of it — instrumentation that is expensive to buy and more expensive to install, often at a station where it is hard to justify.
The Pump Station Calculator derives it instead. It uses the fact that a station has at least two pumps and that one is off while the other runs: given how long a pump was on and the basic parameters of the system, the volumetric flow across it follows. The minimum is two pump channels and a constant.
It sits on top of FACE as a pre-built, templated calculation, so you are not assembling several nested formulas by hand. The output is an auto-generated calculated channel showing the volume each pump produced, with optional interim channels for estimated pumping rate and pump-down cycles — and the raw data is left untouched throughout.
- Volumetric flow per pump, derived rather than metered
- Minimum inputs: two pump channels and a constant
- Optional interim channels — estimated pumping rate, pump-down cycles
- Raw data unmodified; results land in calculated channels
Questions this answers
These are the questions the live site has been answering for facilities teams for years.
- How many hours a day do my pumps run — and are they running evenly?
- Is one pump performing better relative to the other?
- What is the daily average turbidity of the drinking water supply well?
- How much seasonal variation in well level is there?
- Did my chlorination station ever fail to meet minimum chlorination standards?
- Is that pressure reducing valve (PRV) station sticking, and does it open and close at the right pressures?
Pump behaviour, worked out continuously
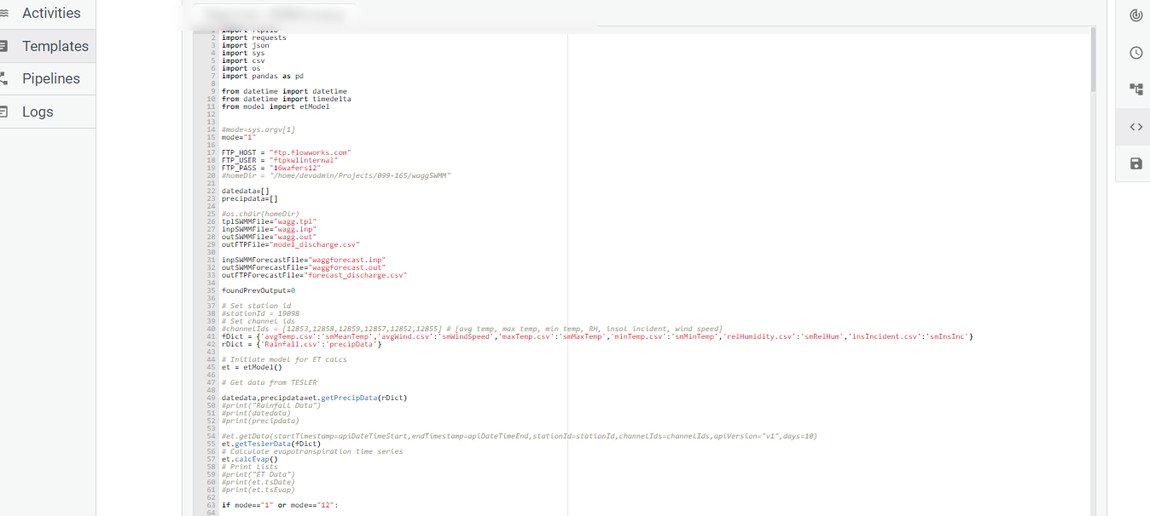
Run hours tell you how long a pump ran. They do not tell you whether it is getting worse. FACE Pro lets the analysis that would answer that be written once in Python and run continuously against the site’s live data, producing channels you graph, alarm and report on like any measurement.
From the script library already in use with customers:
- Pump efficiency and energy — what the station is costing you to run, tracked rather than estimated
- Wet well cycling — cycle counts and durations, where short-cycling shows up before the failure does
- Constant-speed and variable frequency drive (VFD) pump analysis, which behave differently and need different treatment
- PRV performance — whether the valve opens and closes where it is set to, from the record
- Pressure zone statistics and burst detection across a zone
Scripts take site constants as parameters, so one template covers every station of a type rather than being rebuilt per site.
Put the results on a custom dashboard and you have a view of the whole pump fleet — run hours, duty split, efficiency trend and cycling, station by station. That is the screen maintenance planning actually wants, and it is considerably harder to argue with than a recollection.
Who this helps, and how
Operations
A failure notifies somebody the same day, with enough context to decide whether it needs a truck now or a visit tomorrow.
Maintenance planning
Duty balance and run hours as a calculated total rather than an estimate, which makes the rebuild-or-replace decision easier to make.
Energy and operating cost
Pump efficiency and energy tracked as channels rather than inferred at budget time. A station drifting away from its own baseline is usually costing money well before it fails.
Compliance reporting
Produce the monthly numbers from the same record the operators monitored all month, with corrections auditable.
Related
Water
The distribution system the facility serves.
Wastewater
Collection system, overflow monitoring and inflow and infiltration (I&I) analysis.
Alerting & response
How alarms, notification and acknowledgment actually work.
Start with the site you worry about
A demo on your least-instrumented facility is usually more revealing than one on your best.