Industrial process and discharge monitoring
Process, discharge and environmental monitoring for industrial operations — including the remote sites that do not fit a conventional monitoring network.
Where most industrial monitoring starts
The process is instrumented and the data is collected. But it lands in separate systems — the plant historian here, a logger fleet there, lab results in a spreadsheet — and the remote sites are on a different system or no system at all. Any question that crosses those boundaries becomes a retrieval exercise, whether it comes from a regulator, a plant manager, an auditor or your own engineers.
One record, whatever the question is
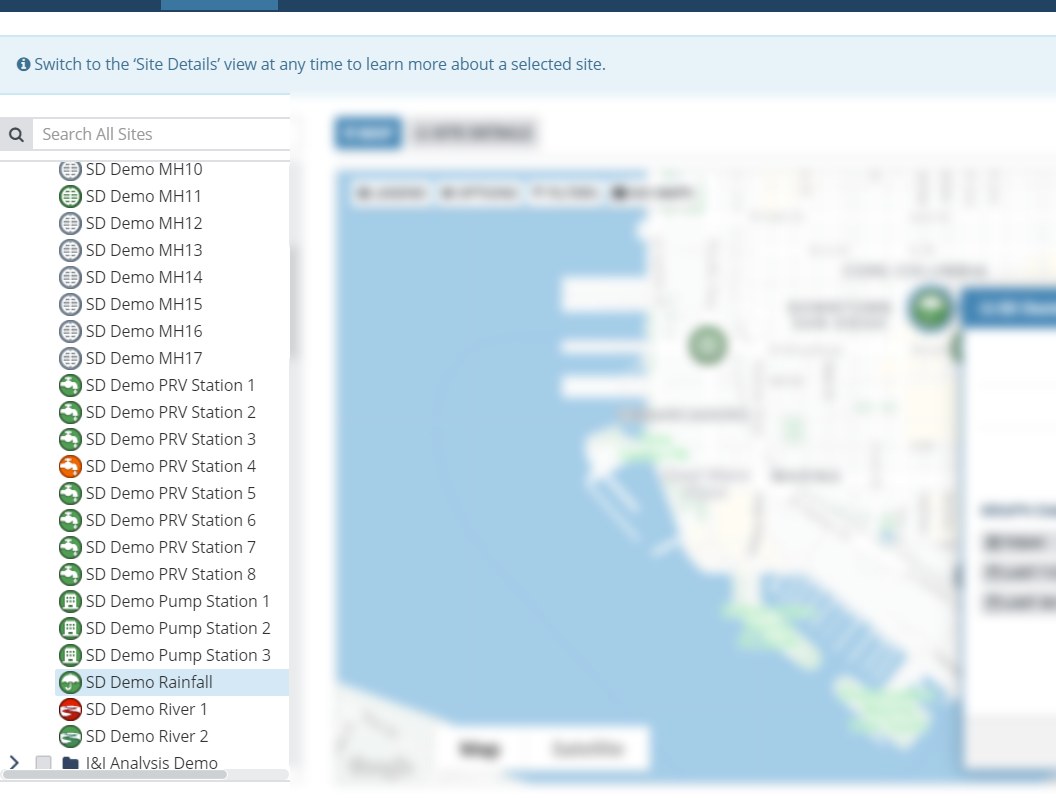
Sites already on SCADA link straightforwardly, as do sites on a data logger, and remote sites reporting over cellular or satellite telemetry connect the same way, into a single source. Once the data is collected it becomes usable, and the insight gained is usually what makes the case for collecting more.
Analysis and reporting then run against a single source rather than exported snapshots, with any corrections visible rather than silently applied. That makes compliance submissions easier and settles internal questions quickly.
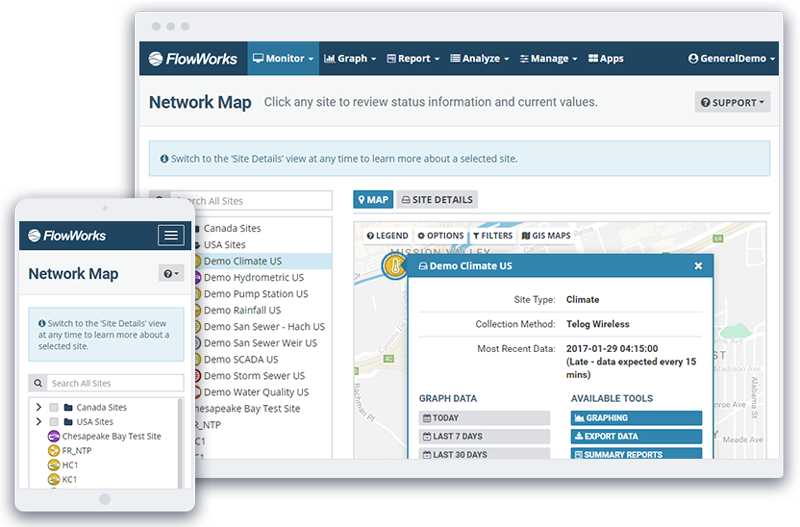
And because the audiences differ, the screens can too. A custom dashboard can be built per audience — one for the plant, one for environmental, one for the people who only need a monthly number — all drawn from that same record, and shared by security group. Viewing one takes either a infinitii flowworks account or a Microsoft 365 sign-in, so a stakeholder can be given their view without being set up as a full platform user.
- Map-based overview with current values at every site
- Daily, monthly and yearly summary reports
- Curve fitting — linear, polynomial, exponential, logarithmic and power — to quantify relationships between process parameters
- Alarm notification when a parameter reaches a critical value
- Metadata storage so lab results sit alongside the online sensors
Not one industry, one kind of problem
We have worked with customers in mining, forestry, and oil and gas. What those have in common is not the sector — it is that each collects time series data across sites that were never designed to report into one place.
The vertical does not matter. If you are collecting time series data for environmental and systems monitoring, we probably have a solution for you.
The reasons people need it vary as widely as the sectors do — an environmental permit, a process question, an energy cost, an insurer, a board report, or simply wanting to know. The platform does not care which of those is driving you.
- Mining, forestry, and oil and gas among current customers
- Any operation collecting time series data across dispersed sites
- Process, discharge, environmental and utility data in one record
- Remote locations connected over cellular or satellite telemetry
Who this helps, and how
Environmental compliance
The collected or observed number and the reported number are the same, and auditable.
Process engineering
Discover relationships and correlations using complete historical datasets from all available sources.
Management and board reporting
A dashboard built for people who only need a handful of numbers, drawn from the same record the engineers work in — so the monthly number and the live number cannot drift apart.
Remote site operations
Know what is happening remotely, so there are fewer surprises.
Related
Facilities
Pump stations, plants and pressure reducing valve (PRV) stations.
Water
Distribution, pressure and water quality.
Data quality
Editing, flagging and the audit trail behind a reported number.
Bring a report you have to produce
The clearest demo is usually one that reproduces a regulatory submission you currently assemble by hand.